ByggeVejr
Weather risk planning for construction sites — forecasts turned into per-activity risk heatmaps so site managers know which days to reschedule.
Try it live →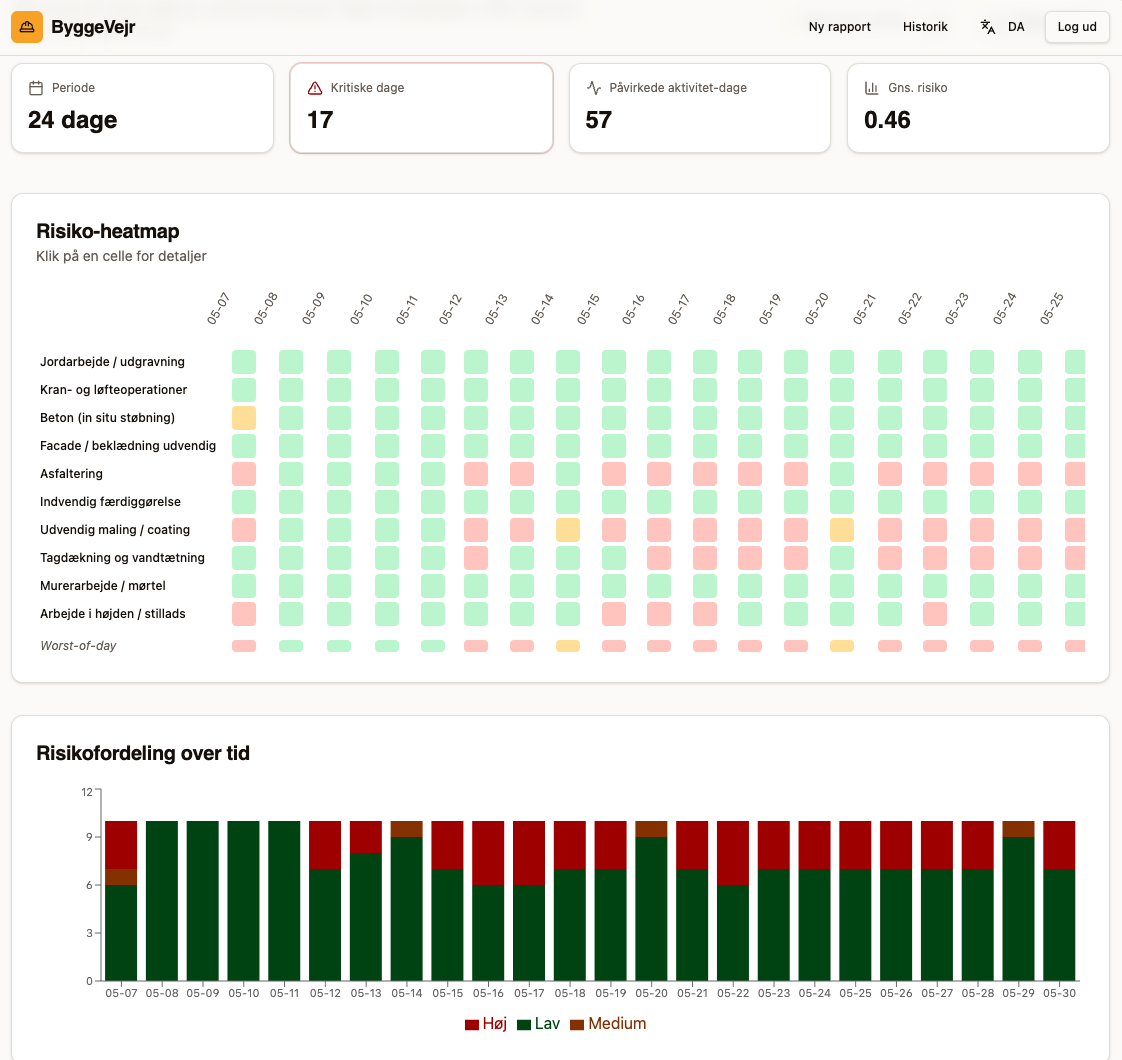
The story
Construction schedules live and die by the weather. ByggeVejr ("ByggeWeather" in Danish) takes a project's forecast window and turns it into something a site manager can actually act on: a heatmap of which activities are safe, marginal, or critical on each day.
What it does
- Pulls a multi-day forecast for the site location
- Scores each construction activity (concreting, crane lifts, asphalting, work at height, etc.) against weather thresholds
- Renders a risk heatmap so critical days, affected activities, and average risk are visible at a glance
- Tracks risk distribution over time so teams can spot patterns and plan around them
- Danish-first UI for the local market
What I learned
Domain-specific scoring rules (wind speed for crane work, temperature for concrete, precipitation for asphalt) turn a generic weather API into a real planning tool. Lovable Cloud handled auth, report history, and persistence so I could focus the build on the risk model and the heatmap UX.